Consider the case in the callout. While reading it, think about what might be wrong with that way of measuring problem management.
The case study illustrates a typical issue with problem management metrics. Let’s suppose that problem A in that case study caused an average of 2 incidents per month. Assume, further, that it took the company one month to resolve the problem. Now, let’s suppose that the problem resolution took two months instead of one month. That means there would have been two more incidents caused during that extra month, which means that the purported savings to the company would be $1’315’000 instead of $1’115’000. In other words, by during a poorer, slow job of resolving the problem, the measurement actually looks better!
Measuring problem management
The lesson from this case study is that problem management effectiveness should not be assessed relative to what had happened in the past. Instead, it should be assessed relative to what is likely to happen in the future.
Given the difficulties associated with defining good problem management metrics, it is easy to fall into the trap of using ineffective proxy metrics in their place. Let’s look more closely at what these mean for the definitions of problem management effectiveness and efficiency metrics.
Measuring what does not happen
Problem Management belongs to that class of disciplines where success is measured by the absence of deleterious events. So deciding on problem management metrics is inevitably a compromise between defining metrics that are meaningful and metrics that can be measured. And when it comes to measuring the efficiency of problem management, we are faced with the issue that each problem is sui generis. Unlike an activity such as fulfilling certain service requests, where each fulfillment is essentially the same and comparable, one to another, resolving a problem is different each time. Of course, we may use the same methods for handling each problem, but we can hardly compare the time it takes to build a doghouse to the time it takes to build a skyscraper. Let’s examine some of these issues in more detail.
Measuring the effectiveness of problem management means measuring the degree to which the activities result in output that corresponds to the goals. The principal goal of problem management is to reduce the impact of incidents. There are essentially two strategies for achieving this goal. The first strategy is to eliminate causes of problems, or somehow modify the chain of causality, such that the corresponding incidents no longer occur. The second is to find superior ways of resolving the incidents that do recur, in other words, improve the workaround.
Can problem management metrics be aggregated?
In theory, both strategies could be assessed in comparable terms, to have aggregated problem management metrics. For example, if we were able to translate probable problem impact into monetary terms, then we could aggregate both strategies. However, many organizations lack the skills, knowledge and willingness to assess problem management in purely economic terms. Other types of assessment are even more difficult to compare. How do compare, for example, the motivation deriving from creating a successful workaround to the motivation from successfully eliminating the causes of a problem? Thus, each strategy requires its own metrics.
Problem management metrics and FMEA
If we are to measure how much we reduce the impact of incidents, then we need to be able to predict what incidents are likely to occur, predict their probable impacts, and predict their pattern of recurrence over time. This is precisely the activity performed by Failure Modes and Effects Analysis (FMEA), an activity that is part of virtually all engineering, except the design of IT systems. There are certainly some organizations that make such analyses, but they are exceptions that prove the rule. In my career, I have never seen an IT organization that systematically includes an analysis of the probable weaknesses of a system and how to mitigate them—beyond the anti-pattern of building in redundancy, which is often the IT equivalent of sweeping dirt under the carpet.
Predicting incident occurrence patterns
Be that as it may, predicting when a certain type of incident might recur is fairly simple in some cases and quite imprecise in others. This uncertainty has an impact on defining problem management metrics. Take the example of a batch job executed just before the start of each business day that has a bug in it. One quickly realizes that the problem will cause an incident each business day. This is the simplest type of case, being highly predictable. At the other extreme are incidents that seemingly occur in a random pattern, but at least they occur frequently. For example, a certain memory leak in an application may inevitably cause the platform on which it runs to crash, so long as the process concerned runs long enough. So long as there are a significant number of platforms running the application, and the application is run long enough, it becomes simple to extrapolate the count of the probable future incidents. The difficult cases are the zero-day problems, or the seemingly random problems that provoke incidents only rarely. While we might still extrapolate a future pattern of incidents, that extrapolation is likely to have a very low precision.
Problem management metrics horizons
After estimating the future pattern of incidents, it is important to identify the duration over which future incident impact is to be measured. This horizon shouldn’t be too short, as it might filter out relatively rare, high impact incidents. Nor should it be too long, for two reasons. First, the longer the duration, the harder it becomes to predict the future impact. Second, may problems disappear without an explicit resolution by problem management. This is due to changes in patterns of service use, changes in technology, changes in system configurations and changes in versions of components, among other changes. I consider a duration of one year to be a reasonable horizon for the metric.
Furthermore, we need to estimate the impacts of the incidents themselves. Most organizations limit their impact assessments to ordinal metrics, such as “high”, “medium” and “low”. In other words, they can say that one incident might have a higher impact than another, but they cannot say by how much. Such ordinal metrics limit the ability to aggregate results and make the top level metrics much more complicated, than if impact were measured using an integral statistic, such as the estimated monetary cost to the organization of the incident.
Finally, a process metric needs to be defined in relation to the drivers of the process. For example, the claim that problem management has eliminated 1’000 high impact incidents over the following year means one thing if there are typically 2’000 such incidents per year, and a completely different thing if there are typically 10’000 such incidents per year. Things become very tricky here.
Metrics drive behavior
Suppose we relate the reduced impact to the total number of incidents that are predicted to occur (and their cumulative impact). This works well when we can predict future incidents with some precision. The fewer the incidents, the better the measurement of the process. For this same reason, we must not relate the metric to past incidents, because the more we have had incidents in the past, the better the metric, which is exactly the opposite of what we want to achieve. Let’s take an example to clarify this point. Which would be better: resolving a problem that caused 10 high impact incidents in the past, or resolving a problem that only caused 2 such incidents? If you would tend to answer that the former is better, consider that this would encourage you to slow down problem resolution in order to demonstrate that it is resolving more incidents! I repeat: problem management should be measured in terms of the probable future, not in terms of the past. In short, for problem management metrics as for any other metrics, people tend to act in a way that shows good measurements. The metrics must be defined so as to influence that behavior in the desired direction.
Examples of Predicting Problem Impact
The following cases illustrate the issues described above in defining useful problem management metrics.
Case 1: Resolving a problem that causes incidents frequently
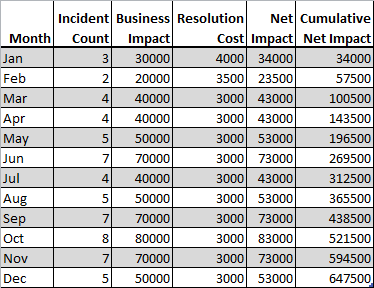
In fig. 1 we see a table showing the historical record of the impact of incidents due to a certain problem, over one year. Note that there were over 60 incidents during that year.

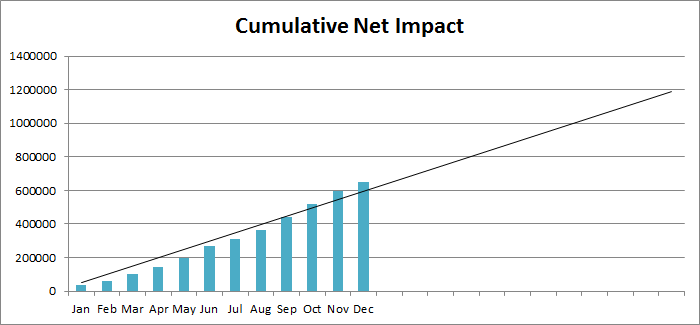
Let’s make an assumption that the conditions in the organization will not change over the course of the following year, even though this assumption is almost certainly false. We may graph the cumulative net impact over time and extrapolate that impact over an additional horizon of twelve months. The result is in Fig. 2.

The cumulative net impact at the end of December is 647’500 and the predicted cumulative impact after two full years is just shy of 1’200’000. If, by some miracle, the problem were resolved instantaneously at the end of December, and at no cost, the estimated annual net savings would be 552’500.
In reality, from the moment that it is decided to resolve the problem until the moment the problem no longer triggers incidents will take some time and will cost something. Let’s assume that there are an additional 6 incidents during this time, with a net impact of 57’000 and that the cost of resolving the problem is 50’000. In this case, the net savings until the end of the year will be 552’500 – 63’000 – 50’000 = 439’500. If problem resolution takes two months instead of one month, resulting in, say, 10 additional incidents and a problem resolution cost of 75’000, then the net savings might be something like 552’500 – 108’000 – 75’000 = 369’500. This analysis shows clearly the interest in quickly resolving problems that trigger frequent incidents.
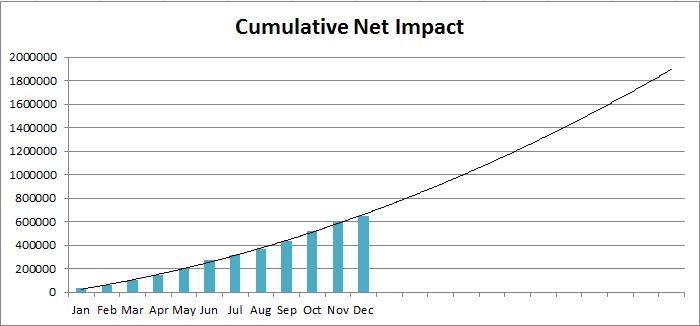
But what about our assumption that the problem will continue to trigger incidents at the same rate, resulting in a linear approximation of the cumulative net cost of the problem? It might turn out that the curve fitting the cumulative cost is not linear at all, but is a second order polynomial (or some other function). The resulting graph is shown in Fig. 3.

The cumulative impact after two years is now closer to 1’900’000, instead of 1’200’000. Most companies would treat the 700’000 difference as extremely significant. We might make very different decisions about the number of resources to invest in resolving the problem, its priority or the decision to resolve definitively or to seek an improved workaround.
The solution to this issue involves trying to understand the business drivers that impact problem impact. Perhaps the impact of the problem is related to the number of system users, or related to the volume of business transactions or to the number of customers. If we can understand what the business drivers are and how they relate to problem impact, we are in a better position to predict the probable future impact of the problem. The important point to retain is that simplification (such as assuming a linear, non-changing evolution of impact) is not necessarily a good business decision.
Having evoked the importance of understanding the business drivers of problem impact, it is further useful to note that the relationship between those drivers and the impact is not likely to remain constant. This is especially true as a problem becomes older and remains unresolved via problem management. What tends to happen?
The first tendency is for problems to simply disappear. Of course, there is no magic involved. The phenomenon simply indicates that how little the problem was understand, in terms of its causes and its business drivers. Typically, one or more changes will break the chain of causality, without ever really understanding the relationship between the changes and the problem.
The second tendency is for the users of the service to work around the problem, without ever systematizing this change and without receiving any proposed workaround from the service provider. Service consumers learn in time to avoid behavior that is correlated with pain. From the perspective of customer impact, the problem becomes less important. The slope of the curve showing cumulative impact starts to decrease. It may level off, approaching some asymptote, or that slope might even become negative.
Finally, many problems are due to a series of compounding causes. One or more of those causes might be resolved, leaving the problem but lowering its cumulative impact.
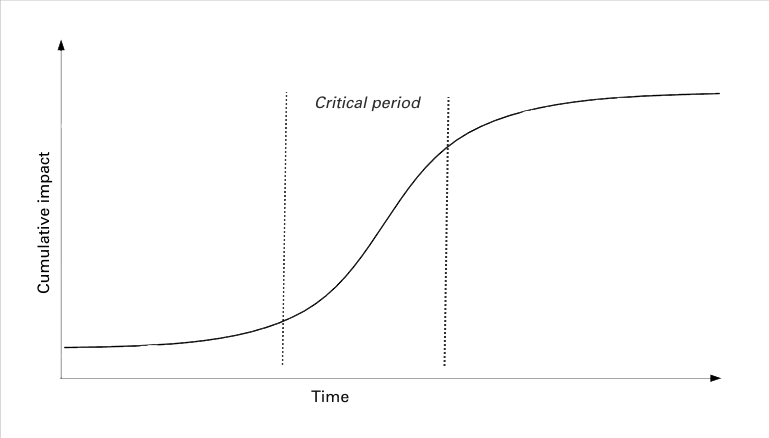
The result of these tendencies is for the curve of cumulative net impact tends to resemble the curve of a standard cost of delay, as shown in Fig. 4.

The cumulative impact increases slowly, at first. It then reaches an inflection point at the start of a critical phase, where impact starts to increase rapidly. Finally, it reaches a second inflection point, where the cumulative impact starts to level off, as the problem becomes less and less relevant.
Case 2: Resolving a problem that causes incidents at a predictable interval
We may refine our analysis for the case of a problem that triggers incidents in a predictable way. Suppose a problem causes an incident after each quarterly closing in a company. In this case, the analysis of the cost savings for resolving the problem more closely resemble a fixed date pattern in a cost of delay analysis. In other words, suppose we identify and decide to resolve a problem immediately after an incident related to a quarterly closing. That means we have three months to resolve the problem, before the next incident will occur. Solving the problem sooner than three months will not increase the net savings. On the other hand, taking more than three months to resolve it will result in yet another incident. In prioritizing work on such problems, we may choose to delay work on the problem until the last responsible moment, on the assumption that the people in the problem solving group have other work to do whose short term cost of delay would be higher. Of course, the great difficulty is to predict what the last responsible moment would be.
Case 3: Problems causing rare incidents
When only the rare incident can be attributed to a problem, the cumulative net impact is extremely difficult to predict, unless the causes of the problem are already understood. Once again, when the impact of the triggered incident is at one extreme or another, it remains simple to determine how to proceed. If the incident has a very high impact, most organizations assume that the risk is simply too high to ignore the problem, even though the pattern of future incidents cannot yet be determined. If the incident has a very low impact, most organizations will adopt and wait-and-see approach. In time, a discernible pattern may appear, or the incident will not recur.
The middle cases are more difficult to assess. On the one hand, if it will turn out that the incident will recur frequently, it will have a shame not to have worked on the problem. On the other hand, working on a problem that does not turn out to have a significant net cumulative impact would be an inefficient use of resources.
These middle of the road cases highlight the value to an organization of a lean and agile approach. By committing to handling problems in an incremental way, it is possible to quickly divert resources to other tasks, should the problem fail to develop in impact. Inversely, such organizations can more readily free up resources to address problems that unexpectedly develop in cumulative impact. Furthermore, by adopting the principle of committing to work at the last responsible moment, additional time is made available to assess how the impact of a problem might evolve. As a result, there are fewer context switches in work, better flow of work and the ability to handle higher loads of work much more quickly.
Problem management metrics in resumé
Most organizations using problem management metrics content themselves with the primitive counts provided by their supporting tools.¹ By themselves, these counts only indicate if you are keeping busy, but give no indication that you are doing the right thing, that your problem management is effective and efficient.
There are three main challenges to defining of good problem management metrics:
- Measuring what does not happen
- Assessing incident impact in economic terms
- Aggregating cause removal with improved workaround creation
Successfully meeting these challenges requires the development of appropriate skills, knowledge and methods. It especially requires the willingness to go beyond the primitive seat-of-the-pants assessments that many organizations practice. For, lacking the commitment to developing problem management know-how, an organization is condemned to flying blind in its attempt to getting the best return on its investment in problem management.
![]() The article Problem Management Metrics by Robert S. Falkowitz, including all its contents, is licensed under a Creative Commons Attribution-NonCommercial-ShareAlike 4.0 International License.
The article Problem Management Metrics by Robert S. Falkowitz, including all its contents, is licensed under a Creative Commons Attribution-NonCommercial-ShareAlike 4.0 International License.
Notes:
1 This issue is compounded by the advice provided by ITIL® on problem management metrics (see Service Operations §4.4.8). The counts and mean statistics recommended there are quite meaningless by themselves. And some of the metrics suggested there are very ambiguous proxy metrics (see above). All such statistics must be related to the drivers of the process if they are to be useful metrics.


Leave a Reply